Introduction
The March 2026 monthly report from Inter State Generating Stations (ISGS) provides a detailed snapshot of electricity generation across India. It highlights total generation, regional capacity, and the contribution of solar and wind assets within the ISGS network. Understanding these figures helps policymakers, investors, and industry stakeholders gauge the progress of renewable integration and regional performance.
What Does the Data Reveal About This Topic?
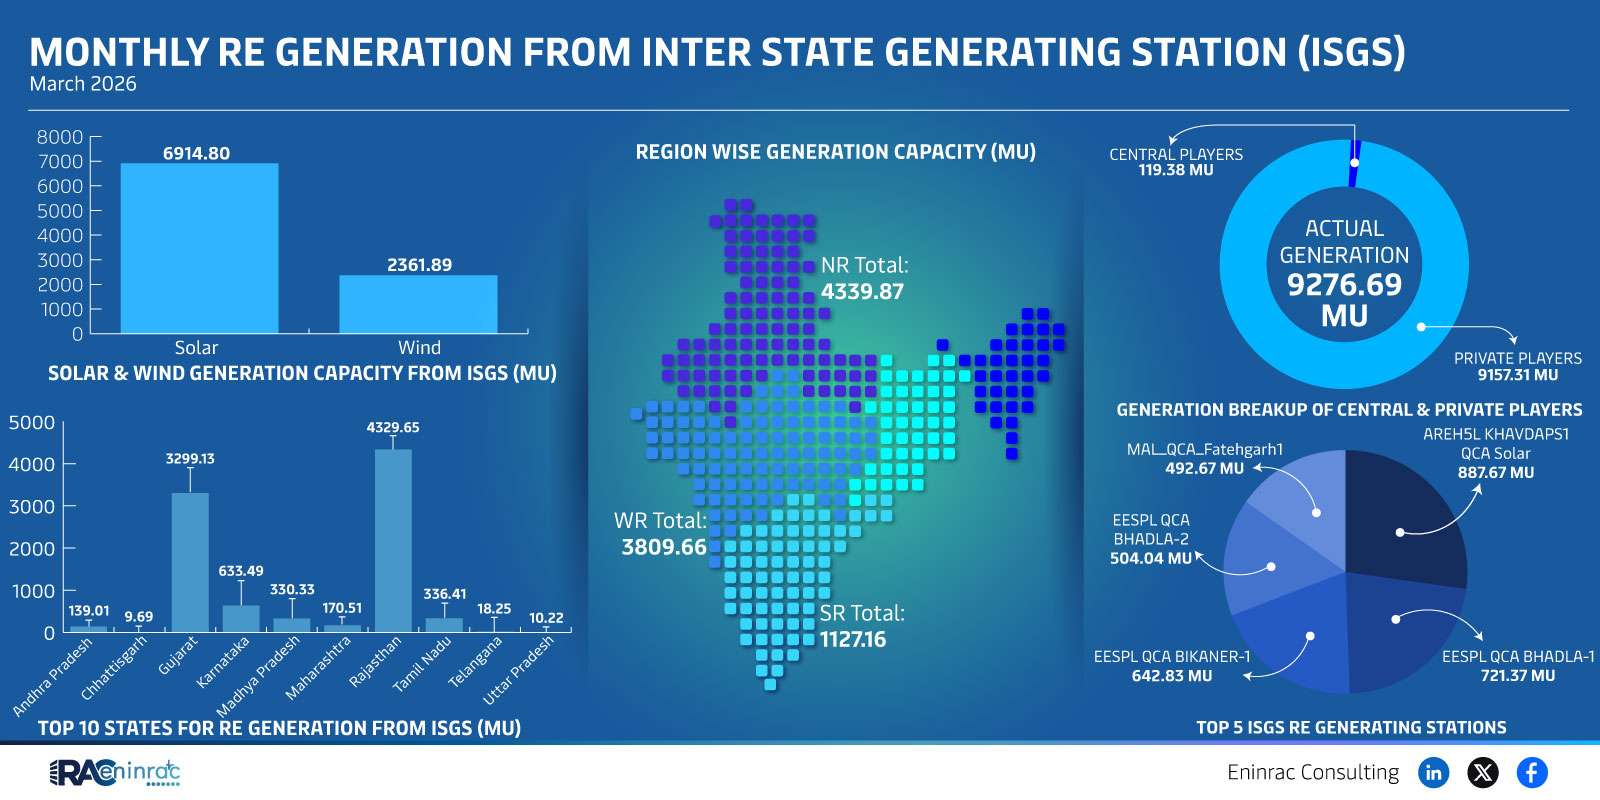
The data shows that ISGS generated 9,276.69 MU in March 2026, with a notable solar and wind capacity of 9,157.31 MU. This indicates that renewable sources account for the majority of the station’s output, underscoring a shift toward cleaner energy. The regional breakdown further reveals that the highest generation comes from areas contributing over 2,361.89 MU.
Regional Generation and Capacity Highlights
When comparing regions, the chart indicates that the top‑performing zones exceed 2,000 MU each, while smaller regions contribute between 500 and 1,000 MU. The leading ISGS facilities, such as BHADLA‑2, demonstrate strong solar and wind output, reinforcing the importance of location‑specific resource availability. This comparative view helps identify where future investments could yield the greatest returns.
Impact on Sectors and Industries
The surge in solar and wind generation influences multiple sectors. Utilities benefit from reduced reliance on fossil fuels, lowering operating costs and emissions. Investors see a more attractive risk‑adjusted profile for renewable projects, encouraging capital inflow. Policymakers can use the data to refine incentives and grid‑integration strategies, while equipment manufacturers experience heightened demand for turbines and photovoltaic modules.
Key Takeaways
- ISGS generated 9,276.69 MU in March 2026, driven largely by renewable sources.
- Solar and wind capacity within ISGS totals 9,157.31 MU, representing the bulk of generation.
- Regional output varies, with the highest contributors exceeding 2,300 MU.
- Top stations like BHADLA‑2 showcase the effectiveness of location‑specific renewable deployment.
- Increased renewable generation supports lower emissions and operational cost savings for utilities.
- Strong performance attracts investment and encourages policy support for further renewable expansion.
FAQs
What was the total generation by ISGS in March 2026?
The total generation recorded was 9,276.69 MU.
How much solar and wind capacity does ISGS have?
ISGS reports a combined solar and wind capacity of 9,157.31 MU.
Which region contributed the most generation?
Regions exceeding 2,300 MU, such as the area highlighted with 2,361.89 MU, were the top contributors.
What is the significance of BHADLA‑2 in the report?
BHADLA‑2 is highlighted as a leading station with strong solar and wind output, illustrating effective renewable deployment.
How does this data affect investors?
The strong renewable generation improves the risk‑adjusted returns of energy projects, making them more attractive to investors.